Webpage checker · newspectrum.org
Pharmacy consolidation: outlets, sales shares and page analysis
Visit newspectrum.orgRead the original long read ↗
A historical market account separates ownership changes, outlet counts, sales coverage and operating economics.
Live HTML checked 16 October 2026 · HTTP 200 · English long read
HTML inspection
Page characteristics
Observed from the fetched public HTML. Counts cover the whole document unless labelled otherwise; article word count includes text within the first article element. These are page characteristics, not a ranking or performance score.
| HTTP status | 200 |
|---|---|
| Final response URL | https://newspectrum.org/features/ns-2024-feat-18/ |
| Title tag | Russia's Pharmacy Chains Return to Deals: How the Top 20 Took Two-Thirds of the Market — newspectrum.org |
| Title length | 104 characters |
| Meta description | Top-20 pharmacy chains took 66.4% of Russia's retail drug market in H1 2024 as M&A returned: Rigla, April, Neo-Pharm and BSS all bought networks. |
| Description length | 145 characters |
| HTML language | en |
| Canonical URL | https://newspectrum.org/features/ns-2024-feat-18/ |
| Meta robots | index, follow |
| Viewport | width=device-width, initial-scale=1 |
| Heading counts | H1: 1 · H2: 18 · H3: 6 · H4: 3 · H5: 0 · H6: 0 |
| H1 text | Russia's Pharmacy Chains Return to Deals: How the Top 20 Took Two-Thirds of the Market |
| Article element word count | 2,536 words |
| Whole-page image elements | 23 |
| Images with non-empty alt text | 23 |
| Whole-page links | 46 |
| External link elements | 14 |
| Response HTML size | 33,540 bytes (UTF-8 snapshot) |

Article overview
Pharmacy consolidation changes the organization of retail without making outlet counts and sales shares interchangeable. Newspectrum examines Russia’s 2024 pharmacy market through a reported top-twenty sales share of 66.4 percent and a network count of about forty-one thousand locations. The source places these figures beside a national total near eighty-two thousand pharmacies. Their different proportions describe different measures. They do not by themselves establish the profitability, customer access or purchasing terms of every chain and independent outlet.
The article reports first-half commercial-market growth of seventeen percent in value and 0.7 percent in volume. That divergence raises questions about prices and product mix, but the aggregate figures cannot isolate each contribution at an individual store. The top-twenty share comparison also needs its stated periods: a prior-year observation and a first-half result are not automatically identical seasonal windows. Similarly, second-quarter leadership and half-year rankings can differ without contradiction. A careful comparison preserves both the period and whether the denominator concerns retail medicines, a broader commercial segment or the total pharmaceutical market.
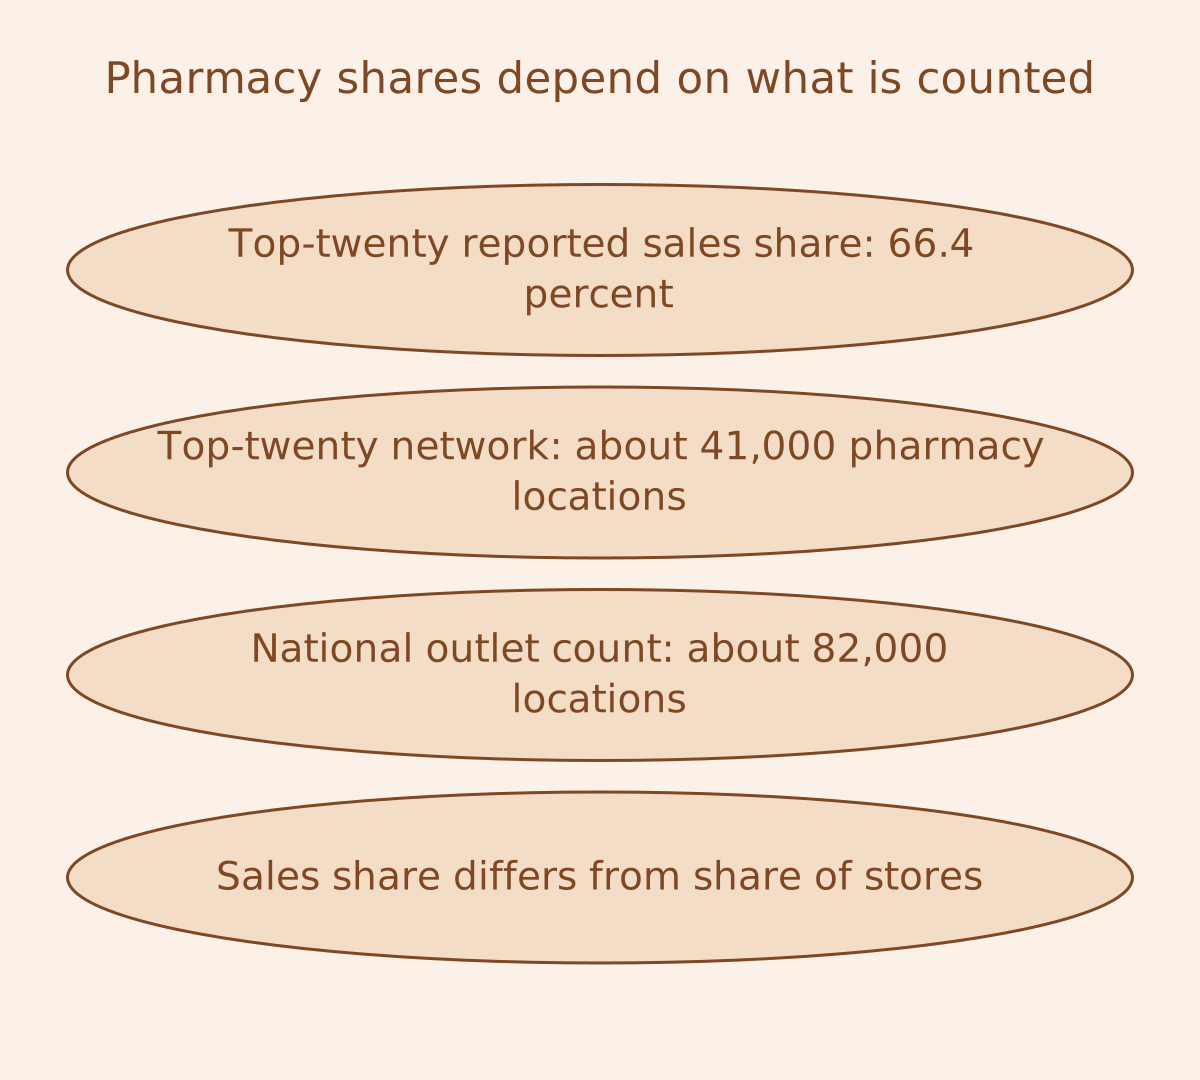
Deals and new locations supply separate paths to scale. The source lists acquisitions involving Rigla, Neo-Pharm and other networks, alongside organic openings and proposed disposals. An acquisition can transfer existing outlets between owners without increasing the national store count. An announced sale is not necessarily a closed transaction. The article’s interpretation links scale with manufacturer negotiations and operating economics, but concentration alone does not demonstrate coordination among buyers or guarantee lower consumer prices. Those conclusions require evidence about actual conduct, terms and outcomes.
The operating discussion connects rents, staffing and expansion into new housing. These factors can influence a location’s economics while affecting different businesses differently. A rise in national sales value does not establish that all stores generated more profit or that acquisitions were successfully integrated. Online bookings and other ecommerce measures also need their own definition rather than being added to physical-store sales as an entirely separate market. The source’s later annual data and 2025 expectations extend beyond its initial half-year snapshot; they should remain labeled as later results or forecasts.
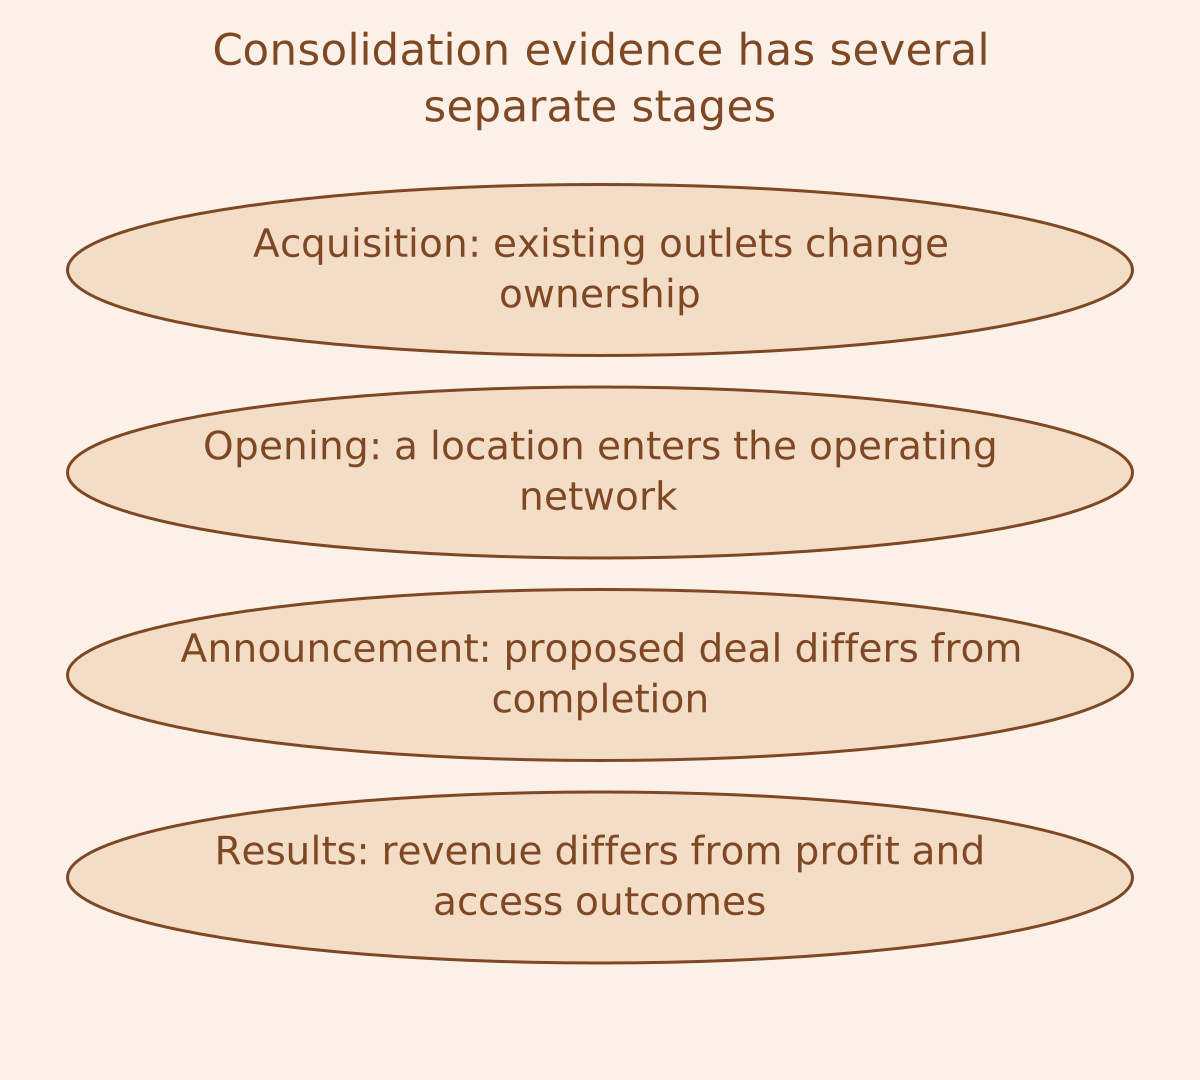
The wider market includes public procurement as well as private pharmacy purchases. Differences between those channels do not by themselves establish how much demand moved from one to the other. Reported supply interruptions identify concerns requiring more specific evidence, rather than proving a complete causal explanation of chain growth. The article’s useful contribution is a framework for following consolidation through ownership changes, openings, sales coverage and operating costs. Keeping those records distinct allows later announcements to be assessed without turning a large ranking share into a universal verdict on competition, availability or the commercial future of every pharmacy.